
HR Strategy
Why Headcount Growth Hides Your Revenue per Employee Problem
How to shift your focus from headcount to efficiency. Learn how to leverage HRMS software for revenue growth to optimize your mid-market performance.

Insha Hamid
Head of HR in Research & Content, Human Maximizer · 14 min read ·

Two numbers moved last quarter at a mid-market SaaS company in Ahmedabad, and only one of them made it into the board deck. Revenue was up. Payroll was up faster. The CEO read the revenue number out loud; the HR head, who had signed eleven offer letters and three counter-offers in the same period, did the arithmetic in her head and said nothing. The deck had no line where the two numbers met. That line is revenue per employee, and the inputs for it are already sitting in your finance system and your Core HR records.
The company above is a composite we assembled to make the pattern visible rather than any client of ours, though the shape of it came out of the conversations we had with HR leaders, managing directors and founders across Indian companies while building Human Maximizer. What is usually missing is not the data. It is the discipline to put the two halves together honestly, and the willingness to look at what the answer says about how you are scaling.
What Revenue per Employee Actually Measures, and What It Misses
The formula is not the hard part. Total revenue for a period, divided by the number of employees who generated it.

Leaders default to studying workforce cost: the salary line, the benefits line, the recruiting line. Cost is easy to see and easy to defend against. The sharper question is what all that spend is producing, and this ratio is the plainest way to ask it.
What it measures is leverage: how much value each person's presence in the system is associated with. What it does not measure is causation. A rising figure will not tell you which people, or why, or whether the gain came from better work or from a price increase your sales team pushed through in March. Treat it as a diagnostic that tells you where to look, not a verdict. Used as a verdict, it becomes another vanity number with a more sophisticated haircut.
There is a second reason to care. Read alongside cost and tenure data, the ratio opens a view into what an employee is worth across their time with you, which is where it stops behaving like a finance metric and starts behaving like a people metric.
The Denominator Audit: Getting the Headcount Half Right
Most articles hand you the formula and move on. In practice, an RPE calculation usually goes wrong at the denominator rather than the numerator. Finance owns revenue and defends it fiercely. Headcount gets pulled from whatever number was on a slide.
Before you calculate anything, audit who is actually in the count.
Convert to FTE, not bodies
A part-time designer at half a week is half a full-time equivalent. Two interns on a four-month project are not two employees for the year. If you are dividing annual revenue by a closing-day headcount, you are dividing a twelve-month numerator by a one-day denominator, and the answer is wrong in a direction you cannot predict.
Weight joiners and leavers by months served
Hire twenty-four people in the last quarter and your closing headcount jumps while their contribution to the year's revenue is barely a quarter of a year each. Meanwhile the twelve people who resigned in August, who did produce revenue, have vanished from the count entirely. Both distortions are fixable with a weighted average.
Count the people who are not on payroll
Contract staff, staffing-agency deployments and vendor teams embedded in delivery are producing the revenue in the numerator. If they are excluded from the denominator, your figure flatters you every time you shift work off payroll. In labour-intensive industries this single adjustment can change the picture more than a year of productivity work.
Fix the definition in writing
Here is the part that decides whether this survives past the first quarter: a process that depends on one person remembering is not really a process yet. If the contractor count lives in an ops manager's spreadsheet and the FTE rule lives in her head, your trend line breaks the month she goes on leave.
Calculating RPE for an Indian Mid-Market Team
Work an example. The numbers below are invented so the method is visible; substitute your own and argue with mine.
Annual revenue: ₹42 crore. Payroll headcount on the last day of the year: 140. The naive answer is ₹42,00,00,000 ÷ 140, or ₹30 lakh per employee.
Now the audit. Twenty-four of those 140 joined in the final quarter, so count them at a quarter each: that removes 18 from the denominator. Twelve people left mid-year after roughly six months of contribution, so add back 6. Eighteen contract engineers worked full-time on delivery all year without appearing on payroll, so add 18. The adjusted denominator is 146, and the adjusted figure is ₹28.8 lakh.
A gap of a little over a lakh per head. Small enough to look like rounding, large enough that a firm congratulating itself on a rising ratio may be watching an artefact of Q4 hiring timing.
Then run the companion ratio that headcount alone will never show you: revenue per rupee of payroll. Take fully loaded cost, meaning gross salaries, employer PF, gratuity provision and contractor invoices. At ₹18 crore, the firm earns ₹2.33 of revenue for every rupee it spends on people.
This is where Indian wage structure matters. Salary inflation and retention counter-offers can push cost up while headcount stays flat, so RPE holds steady and margin quietly erodes. The Code on Wages carries an expectation that basic pay is at least half of total remuneration, which lifts the statutory-contribution base sitting underneath every salary; the Ministry of Labour and Employment publishes the codes and the rules framed under them. Provident fund contributions are calculated on basic plus dearness allowance, and the EPFO pegs the employer's statutory liability to a wage ceiling of ₹15,000 a month, while ESI applies below a gross wage of ₹21,000 a month. Cost per head, in other words, does not scale linearly as salaries rise. Two firms with identical headcount and identical revenue can have genuinely different human capital ROI.
Benchmarking: Why the IT Services Number Is Useless to a Manufacturer
The most common misuse of this metric is comparing across sectors. Software and SaaS business models produce revenue that scales without proportional headcount, so their figures run high by construction. Services firms sell hours, and their ratio is bounded by billable capacity. Manufacturing carries material cost inside revenue and headcount inside the plant. A distribution business books gross merchandise value and looks superhuman.
What is a good ratio, then? The only benchmark that reliably means something is your own, measured the same way, over at least four to six quarters. Build the trailing line first. Compare to peers second, and only against companies with the same revenue-recognition basis and the same contractor mix. Anything else is a number-shaped opinion.
How to Improve Revenue per Employee Without a Hiring Freeze
The two levers everyone reaches for are the crude ones: sell more, or employ fewer. Both work, and both are usually the last resort of a company that never looked at the middle.
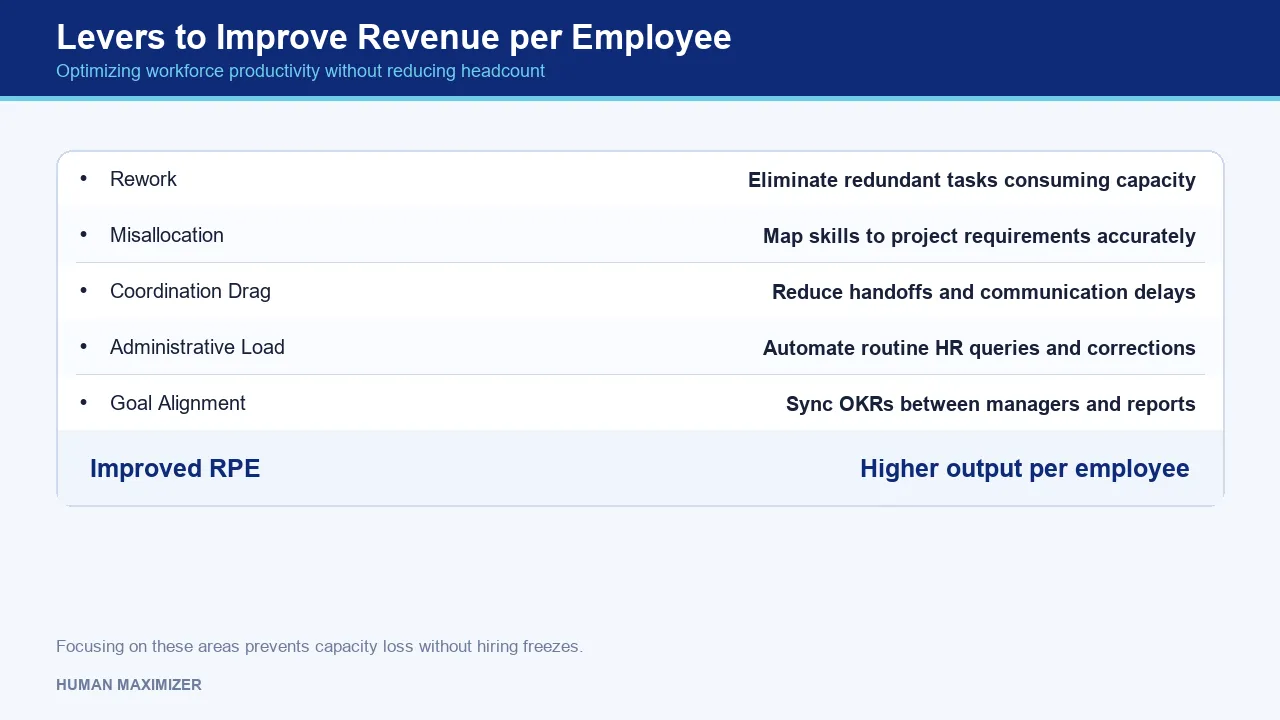
The middle is where workforce productivity metrics earn their keep. Rework is the first place to look, because work that has to be redone consumes capacity twice and appears nowhere in a headcount report. Next is misallocation, where capable people sit on work that does not match their verified skills, the gap our Know Your Employee module exists to close by mapping individuals to project requirements on verified skills and past performance rather than on a manager's assumption. (It has nothing to do with banking KYC, despite the name.) Then there is coordination drag, the reason the ratio so often falls right after a growth spurt: adding people adds handoffs, and small delays compound quietly until three teams are blocked and nobody can name the day it started.
Least glamorous of all is administrative load. Every hour an experienced manager spends chasing attendance corrections or answering the same leave-balance question over WhatsApp is an hour subtracted from the numerator. Our guide to measuring employee productivity goes deeper on separating that motion from actual progress.
Goal alignment belongs on the same list. When objectives drift between a manager and their reports, effort continues at full volume in slightly wrong directions, which is the most expensive failure mode in a growing firm because it looks exactly like hard work. Catching that drift early is a tooling problem as much as a management one, and it is precisely the problem our Synergy module was built for. Synergy keeps OKRs synced between managers and their direct reports automatically, so a divergence surfaces on a dashboard in the week it appears instead of waiting for a status meeting to expose it.
Tracking the Metric Without Starting a Data Project
Most mid-market firms do not fail at this because the concept is hard. They fail because assembling the denominator every quarter takes two days of spreadsheet work, so it gets done once, presented once and abandoned.
This is where an HRMS for mid-market teams changes the economics of the exercise. Consider what happens when a contract engineer converts to permanent employment mid-quarter. In a stitched-together setup, someone updates a payroll sheet, someone else remembers to move the person out of the vendor tracker, and the headcount stays wrong until the next audit catches it. Inside a unified system, the conversion updates the employee record once, Payroll picks up the new cost basis with no re-entry, and the person moves from the contractor count to the FTE count in the same instant, carrying a joining date the weighted calculation can actually use.
Across 24 client implementations, counted as at July 2026, monthly payroll corrections fell from 15 to 3. On method: that is corrections raised per monthly payroll cycle, aggregated from our own delivery and support records rather than a third-party audit, with no client named and no figure restated as a percentage we did not measure. Every one of those corrections was a number that would otherwise have polluted a cost ratio. If you want the provenance of the product itself, how it was researched and who builds it is set out on the Human Maximizer about page.
For the productivity half of the picture, Productivity Lens tracks team output through task completion rates and milestone progression using aggregated metadata, not screenshots or keystrokes. It shows where work is stuck, which is the input you need to explain a falling ratio rather than merely observe one. Ratings and trend data from Employee Performance Management then let you ask the harder follow-up: is the drop concentrated in one function, one location, or one cohort of recent joiners still ramping? For the broader argument about HR systems as business efficiency tools rather than compliance ones, see our piece on HRMS software for business growth.
The Culture Trap: When a Rising Number Is Bad News
A climbing figure can mean your people are better supported, better matched to their work and less obstructed. It can also mean you have quietly moved to running a team of forty at the workload of fifty-five, and the number will keep climbing right up until the attrition arrives. The ratio cannot distinguish between the two. From the finance seat, both look identical.
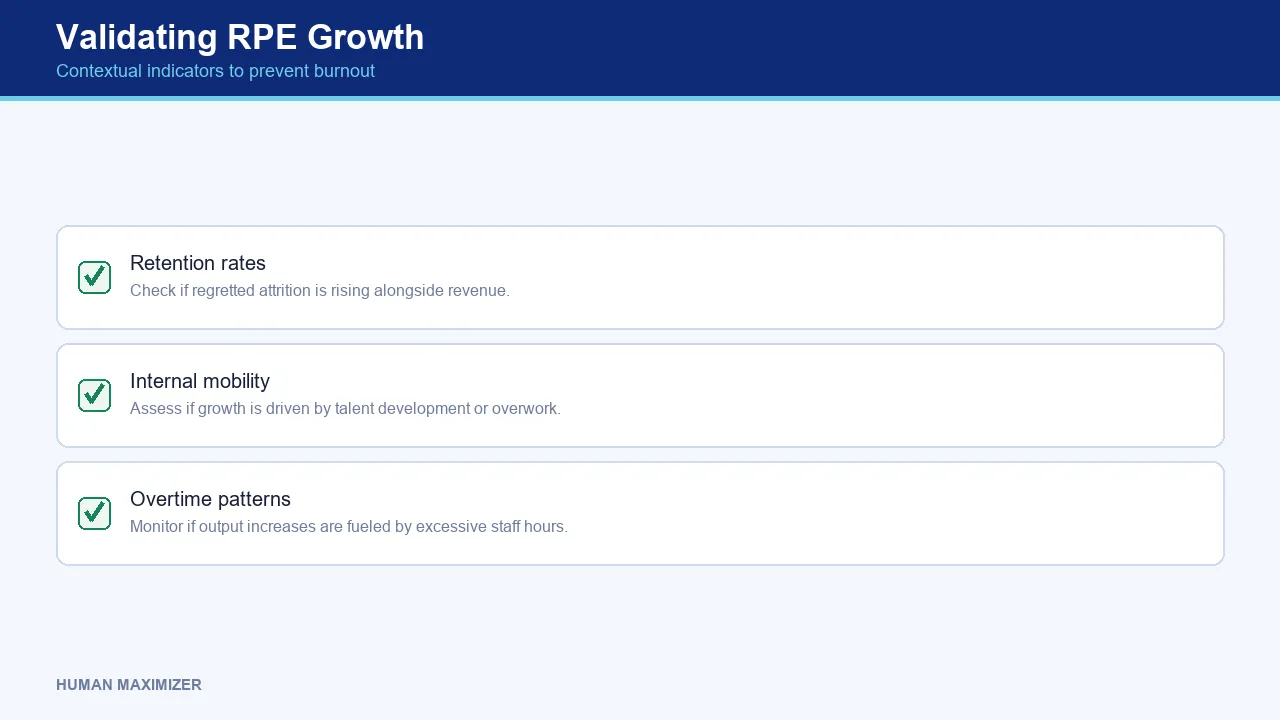
Read it against retention, internal mobility and overtime patterns before you celebrate. A firm whose output per head climbs while regretted attrition climbs alongside it is consuming its own capacity and booking the proceeds as operational efficiency.
Where This Metric Should Not Drive the Decision
Be honest about the boundaries. It is close to meaningless for a business in its first eighteen months, where headcount is built ahead of revenue on purpose and a low figure is the plan working. It also misreads any function whose value is deliberately non-linear: a compliance team, a safety team or an internal audit function generates no attributable revenue and exists precisely to prevent losses that never show up in the numerator.
The most common misapplication is taking an org-wide target, pushing it down to individual departments, and then using it in a headcount-approval conversation. That is the wrong instrument at that resolution, and it hands managers a strong incentive to move work to contractors, which improves the ratio while changing nothing real. When this number informs a restructuring decision, treat it as one input to a judgement rather than the judgement itself.
Frequently Asked Questions
How do you calculate revenue per employee accurately? Divide total revenue for a period by a weighted-average full-time-equivalent headcount for that same period, including contract and agency staff who worked on revenue-generating activity. Using a closing-day headcount against a twelve-month revenue figure is the most common source of error.
What is a good revenue per employee ratio? There is no universal threshold worth quoting. A useful target is your own trailing figure, calculated the same way each quarter, moving in the right direction while cost per head stays stable. Cross-industry comparisons mislead because revenue recognition and cost structure differ so much between sectors.
Why does RPE vary so much across industries? Because revenue means different things. Software revenue scales without proportional headcount; manufacturing revenue includes material cost; distribution revenue includes goods bought for resale. Labour-intensive industries carry more people per rupee of revenue by design, which is a structural fact rather than an efficiency failure.
Can HR analytics software actually improve the number? Indirectly, and that is the honest answer. Analytics do not create revenue. What employee performance tracking and good employee productivity metrics give you is a reliable denominator and a view of where capacity is being consumed by rework, misallocation or coordination load, which is where the practical gains in talent optimization in India sit.
Bringing It Back to the Board Deck
That Ahmedabad board meeting ended the way most of them do, with a revenue number applauded and a payroll number unmentioned. Both figures were correct. Neither one, alone, told anyone whether the company was getting better at what it does. What closes that gap is a single line on the second page of the deck, calculated the same way every quarter, with a denominator somebody has actually audited and a companion ratio showing what each rupee of payroll is returning.
Do that for four quarters and you will know something your competitors are guessing at. Skip it, and the first clear signal you get will be a margin conversation with your investors, arriving about two quarters after the hiring decisions that caused it. That is the lag we would design the reporting to remove.
Want your headcount, cost and output numbers to line up without a two-day spreadsheet exercise every quarter? Take a look at Human Maximizer.
About the Author & Reviewer
Insha Hamid — Head of HR in Research & Content, Human Maximizer
Insha Hamid heads HR research and content for Human Maximizer at Razor Infotech, covering people operations and Indian workplace compliance — translating regulatory change and workplace research into guidance HR teams can act on.
Connect on LinkedIn
Reviewed & approved by Sameer Hameed — Founder & Chairman, Razor Infotech
Sameer Hameed is the Founder & Chairman of Razor Infotech, where he is guiding the creation of Human Maximizer. An entrepreneur across technology, real estate, mining and travel, he builds organisations on clarity, trust and responsible growth — on the belief that businesses grow only when the people behind them grow.
Connect on LinkedIn
Human Maximizer is built by Razor Infotech in New Delhi, India (founded 2019). About Human Maximizer.
Keep reading

HR Strategy
HR Mobile App India: Beyond Attendance
The essential features that transform an HR mobile app for employees from a simple clock-in tool into a powerful hub for productivity and engagement.
15 min read
HR Strategy
Modular HRMS India: Modular HRMS Software
How modular HRMS software allows your business to scale efficiently by adding or removing features as your team grows. Learn to optimize your HR...
16 min read
HR Strategy
HRMS Pricing Model India
The financial impact of per-employee versus fixed-fee structures. Learn how to evaluate HRMS pricing models in India to ensure long-term cost...
15 min read