
HR Strategy
Leave Analytics: The 6 Signals That Predict Attrition
Leave patterns predict attrition 60 to 90 days before a resignation. Here are the 6 signals every Indian HR team should track using leave analytics in 2026.

Richa Thakur
Content Writer · 5 min read · · Updated
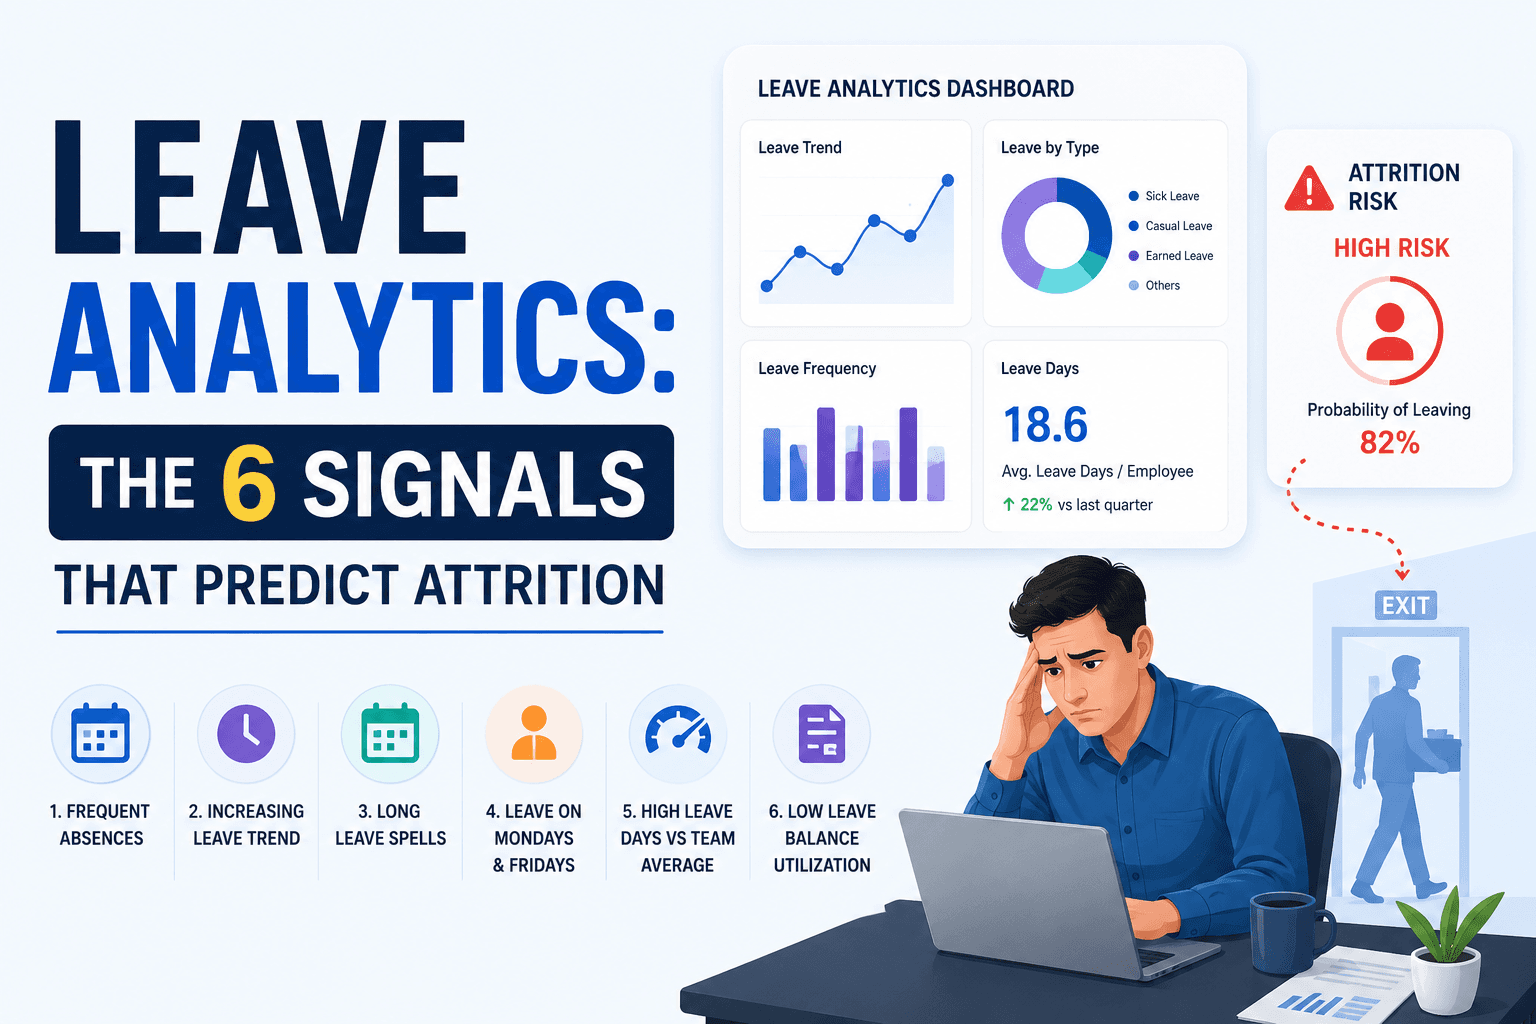
It's a Tuesday morning when Anjali, an HR representative of a 200-employee SaaS company based in Bengaluru, sees a resignation email from her senior engineer. Rohan has been working with the company for 19 months and was one of the most ambitious, intelligent, and skilled employees. This message shocked her, the engineering senior manager, and the founder himself.
They thought they had been blindsided. The truth was that the signals had been sitting in the HRMS for months. Nobody had looked.
Three months ago, Rohan's leave pattern had changed abruptly. His pre-planned and informed leaves turned into sudden, last-minute emergency leaves, and his sick leaves were used thrice in a single month after going six months without taking any. Every one of these signals was neglected by the HR department.
This is where leave analytics becomes critical in identifying attrition risks before employees resign. Leave data is one of the most underused aspects that every HR team collects, but treats it as a compliance record rather than utilising it for strategic workforce planning.
According to Aon's Annual Salary Increase and Turnover Survey 2025-26, now in its 31st year, India's overall attrition rate has declined to 16.2% in 2025, down from 17.7% in 2024 and 18.7% in 2023. The numbers are stabilising, but the cost of missing each exit has only gone up. Replacement costs in India can run from 40% of annual salary for frontline roles to 200% for managerial roles. This data clearly depicts the cost of missing the leave signals.
But the good news is that you don't need machine learning to view employee leave patterns and records. Instead, understand the 6 common early signals that predict employee attrition.
In this guide, we'll cover the following:
What is the real meaning of leave analytics?
Why does it matter for SMBs?
The 6 leave-based signals that predict attrition
Attrition trends in 2026 for Indian HR teams
The process of setting up leave analytics in your HRMS
Common mistakes HR teams make while reviewing leave data
Frequently asked questions on flight risk, attrition rate, and predictive accuracy
What is leave analytics?
Leave analytics is the process of tracking, examining, and interpreting employees' leave data to identify leave patterns and trends. It helps organisations plan their workforce strategically, ensure compliance, and manage employee well-being.
In simple terms, every leave request your employees file is a data point. Looked at one by one, a sick day is just a sick day. Looked at together, across a quarter or a year, those data points tell you which teams are burning out, which managers are pushing people too hard, and which employees are quietly preparing to leave.
Why does it matter?
Leave data supports organisational and employee well-being in the following ways.
1. Strategic Capacity Planning
Businesses can anticipate staffing shortages by analysing leave requests by department or individual. Overall, it allows managers to plan projects and implement them without swapping resources or overstretching the team.
2. Compliance Management
Automated data analysis helps HRMS tools enforce legal and policy rules, such as statutory leave balances under the Shops and Establishments Acts, medical leave entitlements under the Maternity Benefit Act, and accurate paid leave accruals. This ensures fair, transparent, and consistent application of company policy and avoids legal exposure.
3. Employee Well-being
When an employee entirely stops applying for leave for consecutive months, it doesn't show loyalty. It is the first stage of a burnout signal. Leave patterns and attrition data help managers have proactive conversations and make decisions before a resignation lands in the email inbox.
Not only this, but it also identifies the opposite pattern. When an employee takes excessive leave in a month, it signals low engagement and early attrition.
4. Attrition Prediction
This is one of the pivotal factors that matter for an organisation. Usually, leave patterns change 60 to 90 days before resigning. HRMS tools capture and gather the data over time, but due to the lack of an effective framework and checklist, companies fail to spot attrition on time.
6 leave-based signals that predict attrition
When an employee starts mentally preparing to leave, the shift rarely shows up in their words first. It shows up in their leave data. Sick leave becomes more frequent. Half-days appear where full vacations used to be. Long weekends start clustering. Workforce research consistently shows these subtle shifts begin 60 to 90 days before a resignation, sitting quietly inside your HRMS the whole time.
Here are the 6 specific patterns every HR team should be watching.
1. Frequent Unexplained Leaves
When you spot a sudden shift in employee leave, including single-day absences, especially on a day before the weekend, it often indicates that the employee is committed to external activities or attending interviews for better opportunities.
2. Sudden Use of Unpaid Leave
When an employee has utilised all the paid leaves of a specific month or year and is still requesting unpaid leave, it shows a sign of burnout or a need for flexible time for job hunting and interviews.
3. Leave Clustering
Employers often note that leave clustering shows a loss of loyalty in an individual. Rather than taking a standard two-week vacation, disengaged employees start chipping away at their time off. They take several long weekends in a month to escape from their current roles and responsibilities.
4. Increased Sick Leave Spikes
Increased sick leave is a primary indicator of employee attrition risk. Spikes in unscheduled leaves usually reflect underlying workplace issues like chronic disappointment and a toxic work culture.
This pattern of taking sick leave on specific days indicates growing job dissatisfaction, underlying team friction, and pressure on employees.
5. Hoarding Time Off Before Resigning
When employees hoard their PTO rather than taking regular vacation breaks, this often indicates that the employee is waiting until the optimal time to cash out their leave balances upon resignation.
6. Disconnection from Long-Term Planning
This is a clear sign of employee disengagement from the current job role. They stop initiating in meetings, reduce participation in cultural and workplace gatherings, and avoid long-term projects. They often maintain a gap from taking on extended commitments and future-facing activities.
Attrition trends in 2026 for Indian HR teams
If you have been waiting for the post-pandemic attrition storm to settle, 2026 is the year it finally does. But what looks calm on the surface is actually a deeper shift in how, why, and when employees leave Indian companies. The numbers are stabilising. The reasons are not.
India's attrition rate is at a 5-year low.
India Inc's voluntary attrition has cooled to 16.2% in 2025, down from 17.7% in 2024 and 18.7% in 2023, marking a decisive return to pre-COVID stability. For 2026, attrition is projected to ease further to around 13 to 14%, offering companies greater visibility on workforce planning.
But this masks an uncomfortable reality. Nearly 75% of attrition in India remains voluntary, far higher than the 50 to 66% range in major global markets. India is still a job-hopper's market. Employees are just more selective about when they jump.
Sector breakdown for 2026
Aggregate numbers hide the real story. Where you operate determines what your benchmark looks like. If your company's attrition is significantly above your sector's range, you have a retention problem. If it is significantly below, you may be holding on to underperformers, which is a different problem.
Sector
Projected 2026 Attrition Rate
E-commerce
25 to 28%
Fintech and BFSI
24 to 28%
IT services
13 to 15%
Global Capability Centres (GCCs)
~12.6%
Manufacturing
~14%
Metals and mining
~8.6%
The 12-to 24-month tenure band is the danger zone.
Even with overall stability, the 12 to 24-month tenure window remains the highest-risk period across most Indian sectors. This is the tenure at which the new-hire honeymoon ends, the first appraisal cycle disappoints, and competing offers start to feel realistic. Your leave analytics should be running this cohort separately.
Regrettable attrition is rising even as total attrition falls.
The overall number is down, but high-performer churn is becoming the dominant concern. The focus is shifting from volume retention to retaining high-impact talent. For HR teams, this means tracking attrition by performance rating matters more than tracking the headline rate. Losing 10 average performers is a workforce-planning issue. Losing 3 high performers is a strategic crisis.
How to set up leave analytics in your HRMS?
Setting up leave analytics in your HRMS (Human Resource Management Software) involves several aspects. When you're using leave patterns to predict attrition, clearly define your company's time-off policies, configure the system's data tracking rules, and generate reports.
Follow the steps given below to turn your raw data into HR analytics for identifying leave patterns and attrition risk.
1. Digitise and Define Leave Types and Policies
When tracking leave analytics, the first step involves feeding all the data into your HRMS tool, so it knows what the tracking procedure and criteria are.
Input all the leave types, such as sick leave, casual leave, earned leave, and annual leave.
Specify the parameters and limitations of each leave type, whether it is paid, unpaid, or accrual-based.
2. Configure Data Points and Rules
To get reliable leave reports, you need to map out which data points the system should capture.
Ensure all leave requests are routed through the employee self-service portal (ESS) so requests are immediately logged as data.
Set up rules for the reconciliation of data so that the HRMS automatically links paid leaves to the daily attendance records.
3. Set Up KPIs and Dashboards
Instead of relying on raw leave data, establish key performance indicators to exactly know which metrics matter, such as reducing absenteeism or identifying seasonal burnout.
Configure your admin dashboard with the important widgets, such as KPIs and leave usage by department and individual.
Track seasonal patterns, such as spikes in leave requests around vacations and holidays.
Monitor leave liability, which is the financial cost of accumulated, unused paid time.
4. Generate Reports and Take Action
Use descriptive and analytical reports to review employees' historical trends.
Compare the data across different months and the fiscal year to understand why employees are taking off more than usual.
Use this insight to pre-adjust your company culture or staffing models accordingly.
Common mistakes when using leave data to predict attrition
Workforce research consistently shows that the frequency of unscheduled absences is one of the strongest behavioural indicators of attrition risk. Yet most HR managers still treat sick leave as noise rather than as a strong signal.
However, taking sick leave doesn't always mean a disengaged employee. Sometimes it reflects a genuine health-related problem. But entirely missing this data can be an early mistake in spotting resignation risk.
If you want a smooth transition of your company workflow operations and build employee engagement, read the common mistakes below and fix them before they disrupt the organisation.
1. Treating Sick Leave as Noise Instead of Signal
Most HR teams write off sick leave as routine. In reality, a sustained spike in unscheduled sick leave from an employee who previously took none is one of the clearest early signals of disengagement. Track sick leave by individual, not just by team average.
2. Looking at Point-in-Time Data Instead of 12-Month Trends
A single month of unusual leave activity proves nothing. A 12-month rolling view shows the shift in behaviour. Point-in-time snapshots are the single most common reason HR teams miss flight risks that the data clearly shows.
3. Not Segmenting by Tenure
The 12 to 24-month tenure band is the highest-risk window in most Indian sectors. If your leave analytics is not segmenting by tenure, you are looking at an averaged view that hides the cohort actually preparing to leave.
4. Acting on a Single Signal Instead of Clusters
One unexplained leave is not a flight risk. Two or three signals appearing together over the same 60 to 90-day window is the actual pattern. The 6 signals in this guide are designed to be read in combination, not individually.
5. Collecting Data Without Intervention
The biggest mistake is also the simplest. HR teams pull the report, spot the patterns, and never have the conversation. Leave analytics only work when it triggers a stay conversation, a manager check-in, or a structured one-on-one. Data without intervention is just surveillance.
Summing Up
Attrition data analysis only works when the system supports the complete process. Processing data through spreadsheets and cluttered email threads keeps the workflow disconnected. It makes the process challenging and complicated for hiring managers and HR leaders.
With structured HRMS tools, you can identify leave patterns, absenteeism, and turnover risk before an employee resigns. The real-time insights and reports provide a predictive view for strategic workforce planning.
Struggling with employee attrition or rising turnover? Human Maximizer helps HR teams transform leave data into predictive workforce intelligence through real-time dashboards, behavioural analytics, and automated reporting with filters by department, team, and tenure.
We help businesses track leave analytics with transparency and accuracy by:
Cross-referencing leave data with employee headcount and engagement signals through our reports and analytics module.
Surfacing real-time leave patterns on manager dashboards so flight risks become visible before resignations land.
Sending instant alerts when a team's leave data breaches the baseline.
Schedule a demo with us and see how every signal in your leave data becomes a chance to retain talent.
Frequently Asked Questions
How do you predict employee attrition?
You can predict employee attrition by analysing HR data, leave patterns, demographic factors, and employee participation in long-term projects. Organisations can use these insights to intervene proactively and avoid the high cost of employee replacement.
Can leave patterns really predict employee resignations?
Yes, leave patterns are an effective indicator to identify employee resignations. When analysed correctly, the subtle shifts in how often and when employees use their time off can show early behavioural warning signs that an individual is burning out or preparing to leave the company. Most of these shifts begin 60 to 90 days before the resignation email lands.
What is a flight-risk employee?
A flight-risk employee is a team member who is likely to voluntarily resign in the near future due to several factors, such as a lack of growth opportunities, burnout, dissatisfaction with compensation, or a poor manager relationship.
What are the early signs that an employee will quit?
Early signs of employee disengagement are reduced productivity, taking leave more than usual, disengagement with team members, increased absenteeism, and withdrawal from long-term projects.
How does HR predict resignations before they happen?
HR predicts employee resignations by utilising real-time insights, spotting behavioural shifts, engagement drops, and burnout patterns inside the HRMS. The most reliable signals come from leave data, performance trends, and survey sentiment used together.
What is the difference between attrition and turnover?
Attrition and turnover are often used interchangeably in India, but there is a distinction. Attrition typically refers to voluntary, gradual departures such as resignations and retirements. Turnover is the broader term that includes both voluntary and involuntary departures, such as terminations and layoffs.
How do you calculate the attrition rate in India?
You can calculate the employee attrition rate in India by dividing the number of departing employees by your average headcount over a specific period of time and then multiplying by 100. Most Indian companies calculate this on a monthly, quarterly, and annual basis.
Keep reading
HR Strategy
What Is a Leave Management System & Why Do Companies Need It?
Still tracking leave in emails and spreadsheets? See how a leave management system helps Indian companies apply, approve, and track leave, with payroll integration and full compliance.
5 min read
HR Strategy
HRMS vs Manual Leave Tracking: Which Saves More Time?
Stop wasting hours on spreadsheets. Discover how switching from manual leave tracking to Human Maximizer HRMS saves managers time and reduces errors.
14 min read
HR Strategy
What Is Geofencing Attendance? How It Works for Indian Teams
How geofencing attendance marks staff present inside a set location, what it can and cannot record, and where Indian privacy law draws the line.
5 min read